A brief evaluation report here, illustrating cause-effect linkages:
Moment of Zen - Guns in Virginia BarsFox News' Brian Kilmeade urges viewers to grab a gun and go drinking in Virginia.
Tuesday, August 16, 2011
Thursday, June 23, 2011
Does variance 'change' when we compare 2 groups?
Yes [and no], depending on the model we believe in. See e.g. below:

1.A 2 sample t-test compares the difference between means against zero
2.ANOVA uses an F test to compare within-groups sums-of-squares (pretty much how far away individual scores are from each group’s mean) with between-group sums-of-squares (how far away group means are from the overall/grand mean)
3.SEM can compare the means using a chi-square test for the 2-group model
ØALL these 3 methods allow for variances different or assumed/set equal; the last method only estimates [from the 'equal variances model', which may fit better/worse than the 'variances different' model] a new (common, equal) population variance in addition to the 2 population means, i.e. the model yields 1 'NEW' variance, that may differ little/a lot from the 2 sample ones. These differences are taken into account and ‘reported’ along with differences between sample means and estimated means, as part of the FIT of the model. Good fit=ok, bad fit=not ok.
What is a 'variance' after all?
Is it 'set in stone' once we gather data from a sample? Yes and NO, yes in one instance primarily: when we look only at 1 variable , in 1 group only.
If we have 2 groups OR more than 1 variable, say males & females, we can compare the 2 variances, and that means in fact comparing a MODEL with the 2 variances different to another model with them SET equal. The 2nd model here will yield NEW [population] variance estimates for males and females, not surprisingly equal (WE set them =!).
If we have 2 groups OR more than 1 variable, say males & females, we can compare the 2 variances, and that means in fact comparing a MODEL with the 2 variances different to another model with them SET equal. The 2nd model here will yield NEW [population] variance estimates for males and females, not surprisingly equal (WE set them =!).
Monday, March 7, 2011
And a solution
Some alternative models used to test the effect are well-fitting but do not have enough power, others may also be well-fitting, but may not have enough power to detect that specific effect. Quite simply … In this case, the model that couldn't find the effect was 'under-powered', so: a positive intervention effect has in fact occurred!
A simple pre-post comparison
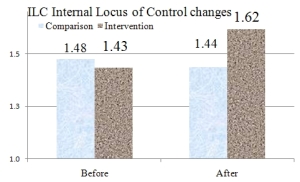
Say you are looking at a change in teenagers’ sense of ‘internal locus of control = ILC’, i.e. whether thy think they are in control of their behavior (high ILC, a max. of 5) or they are not in control (low ILC, min of 1).
You are getting a group of youth to participate in a program, and measure their ILC before (baseline) and after your intervention/treatment, and compare to another group that was not so lucky to find you… The raw numbers would look like the figure below; the question is: DID IT WORK?
The answer can be… 15 different ones (at least using alternative causal modeling): 8 of these ‘tests’ say YES, it did, 7 of them would say NO! So, should you give it a try in you own community based on this ‘evidence’? I’d say you should, mainly because the 7 ‘bad’ models had no statistical power to detect the effect…
The lesson here? There are many models/tests that can answer a simple question, some are better, others worse, one should know HOW to compare the models to be certain the conclusion is sound. Simple? Useful?
Write a comment below.
Subscribe to:
Posts (Atom)


